
Drying Hemp
Results & Methodology (Test 2)
Below are our findings from the second round of testing a rotary (tumble) hemp dryer. We hope the methodologies used and findings discovered will be of use to those still applying this method to hemp.
ABM Equipment has been optimizing & integrating bulk biomass processing systems for over 40 years. ABM has implemented and researched bulk drying & handling solutions for producers and co-ops in the hemp space since legalization.
For testing run 2, our goal was to hit the 10% moisture content with the lowest dryer inlet and outlet temperatures possible to try to prevent CBD degradation from occurring. Figure 1 shows how the moisture content varied as the dryer temperatures fluctuated throughout the day of testing. The x-axis also shows the treatment of the bale prior to drying and what kind of sample was taken. Images 1-3 reference the different samples used for moisture analysis from the coarse, fine, and un-shredded bales as: sticks (the larger stalks and stems), fines (the “premium material with the smallest particle sizes), and mixed (a mixture of the two previous samples). All the samples were taken at the discharge of the existing system, but the screens were by-passed for all testing. We thought the mixed sample would be the best representative sample of the moisture content at the system discharge, but we also wanted to analyze the fines and sticks to determine the lowest and highest cases present in the dried hemp. The fine material moisture content was especially important to ensure the fine particles were not overheating and becoming too dry.
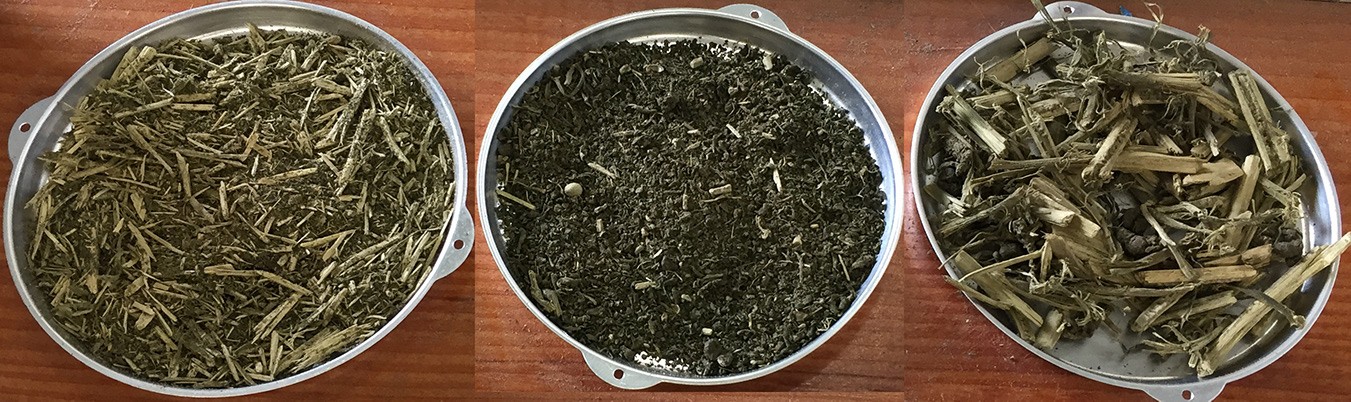
Image 1: Mixed, fine, and stick samples from the coarsely shredded product after drying. (After moisture analysis).
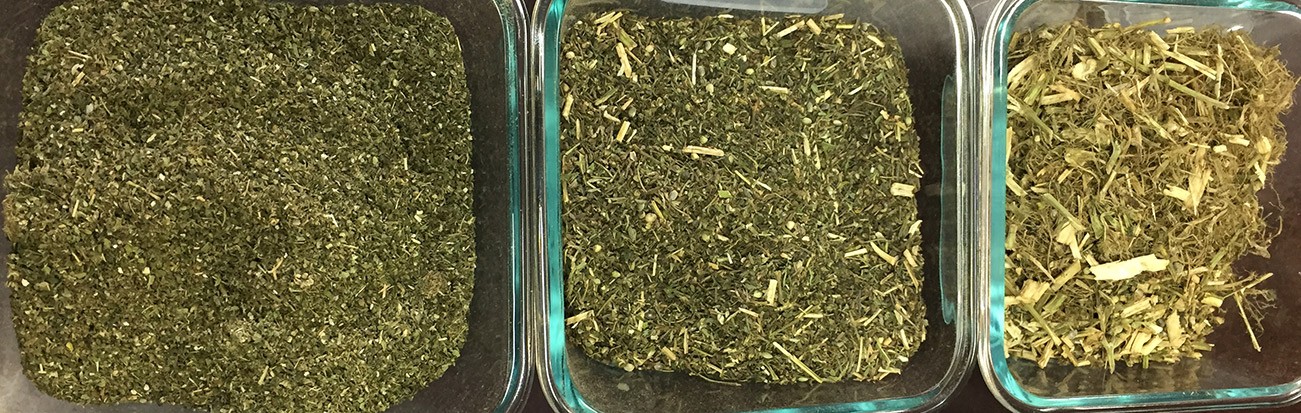
Image 2: Mixed, fine, and stick samples from the finely shredded product after drying. (Before moisture analysis).
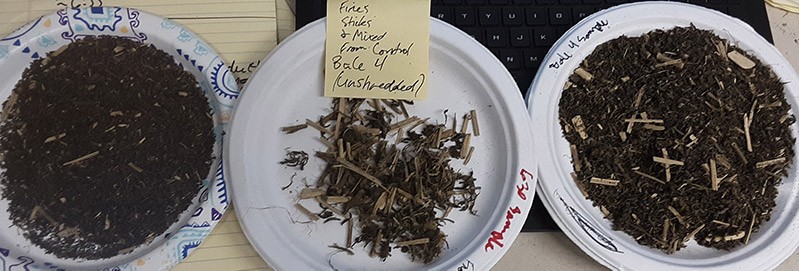
Image 3: Mixed, fine, and stick samples from the un-shredded product after drying. (Before moisture analysis).
The wet bale started at approximately 70% moisture content which was similar to the starting moisture content during testing on 7/25/19, so we assumed 70% moisture content for all the wet bales to evaluate more dry samples with the single moisture analyzer. The outlet temperature was set to 220°F for run #s 1, 3, and 4. Run #2 had an outlet temperature setpoint of 225°F. We measured the amount of time necessary for product to go through the entire system and determined it to be approximately 5-7 minutes after being fed into the dryer. Therefore, when data samples were collected, we waited for a few minutes before pulling a sample from the discharge to ensure the data being collected was representative of the sample that passed through the system. All the data collected is referenced in Tables 1 and 2 but since these were quite large tables, they were left in excel and attached with this document. Figure 1 below compares the moisture content to the measured dryer and product surface temperatures for all the runs.
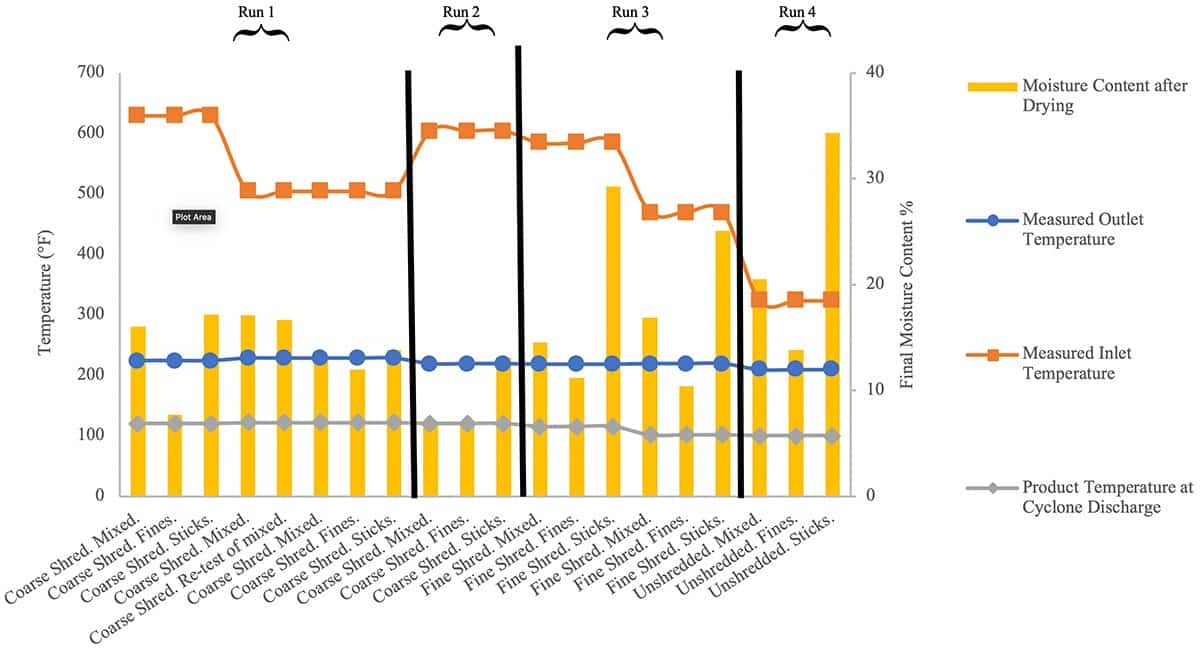
Figure 1: Demonstrates the relationships between the measured dryer temperatures with the measured product surface temperatures and moisture contents after passing through the dryer at the Test 1 facility.
The runs were based on the product’s treatment before drying. Run 1 was of the coarse shredded bale that was of an unmarked bale and was used to determine if the dryer could reach a constant inlet temperature and maintain it with a consistent feed rate into the dryer. We stopped feeding product into the dryer and let the system clear out to separate the unmarked bale from the marked bales, but this prevented the temperature from stabilizing completely. The dryer’s outlet temperature was beginning to stabilize when the inlet temperature was near 500°F as shown in Figure 2, but then we ran out of product. The average moisture content for the mixed material was 15.7%, 9.9% for the fine material, and 15.5% for the stick/stalk material. The mixed samples did have lots of sticks/stalks present, as seen in Image 4, so it makes sense why the mixed value was closer to the moisture content average of the stalks. The discharge at the cyclone also had bigger particles sizes, especially the stalks stems, than when the product was discharged at the end of the system. This is due to all of the augers that the product passes to before being discharged out of the system. The average moisture content of all the testing was at 14.2%. We thought the combination of moisture loss and osmosis occurring in the bulk bag would lead to a finished moisture content close to the final target of 10% moisture, but we bumped this outlet temperature up by 5°F during the next run to try to hit 9%.
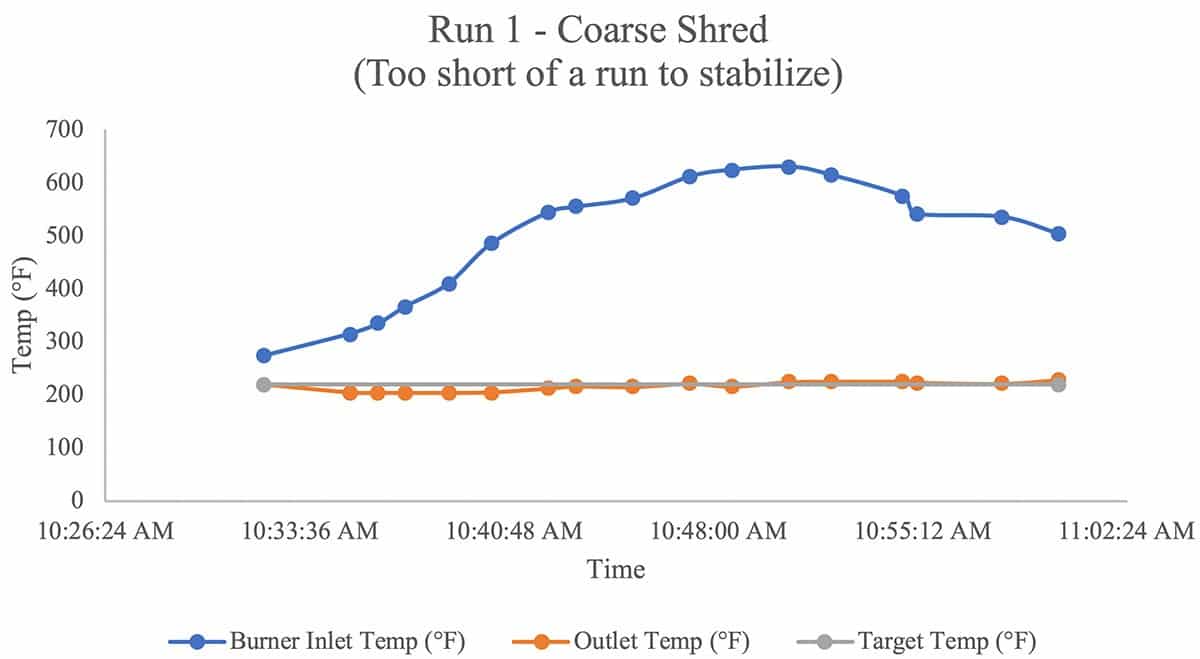
Figure 2: Measured inlet and outlet dryer temperatures during Run #1 using coarsely shredded material. The outlet temperature was set at 220°F.
Figure 3 below shows the measured data collected during Run #2. This run was of the coarsely shredded material from the bale labeled as #11. The temperature outlet setpoint of the dryer was set to 225° to try to determine if we could achieve an average moisture content of all the samples closer to 9-10%. Figure 3 shows the data collected from the dryer measurements during testing. Not very much data could be collected for this run because we didn’t see the outlet or inlet temperatures come close to stabilizing.
The average moisture content of all the three moisture tests of the mixed, fines, and stalks/stem material was 9%. The fines and mixed samples were lower than desired, but we attributed this to the burner inlet temperature that kept increasing after the outlet temperature reached its setpoint. The measured outlet temperature varied ± 16°F and the inlet temperature varied ±100°F trying to regulate itself with the product feed rate while maintaining the dryer’s outlet temperature setpoint. The inlet temperature tried to regulate itself from approximately 3:10 – 3:15, but after 3:15 the inlet temperature began increasing again with no appearance of stopping. We thought the temperatures might be damaging CBD compounds in the product, so we turned off the gas to the dryer and contacted our controls expert to help hard reset the new programming of the dryer. The dryer is running at much lower operational temperatures than it was designed for, so even though it was barely outputting any energy the inlet temperature was still increasing.
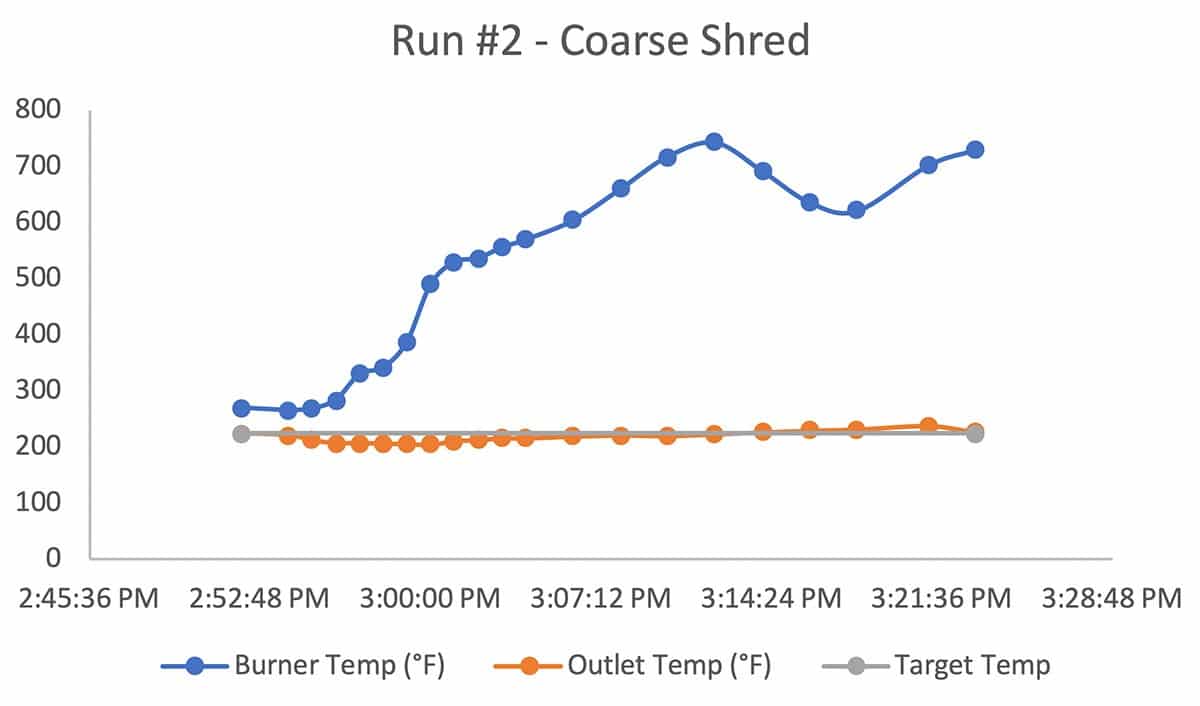
Figure 3: Measured inlet and outlet dryer temperatures during Run #2 using coarsely shredded material. The outlet temperature was set at 225°F.
Run #3 in Figure 4 shows the data collected for the finely shredded material after the dryer controls were reset. The outlet temperature was set back at 220°F. The measured outlet temperature fluctuated ±18°F, but the inlet temperature responded better than the previous run before the controls reset. The inlet temperature can be seen regulating itself with the continuous product feed, but after an hour of product feeding it still wasn’t stabilized at a consistent temperature. The average moisture content of the mixed samples at the system discharge was 15.7%. The moisture content of the fine material was at lower 10.8%, and the stalks/stems had a much higher moisture content at 27.2%. The total average moisture content of all the tests was approximately 18%.
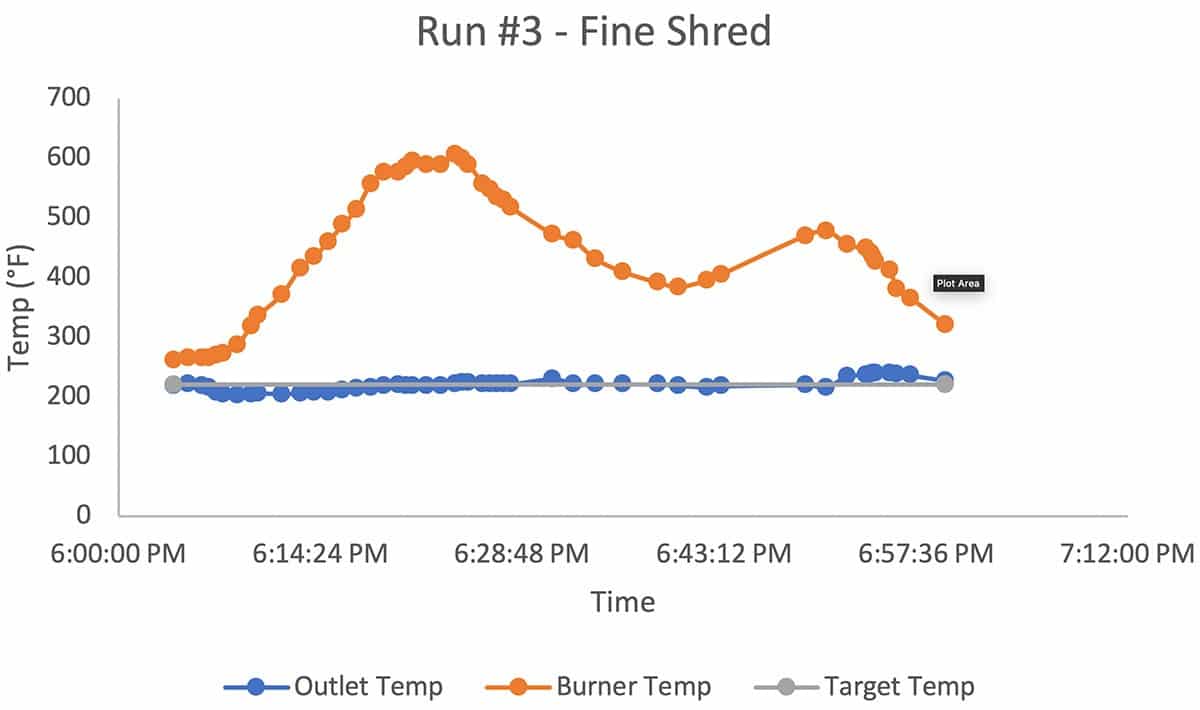
Figure 4: Measured inlet and outlet dryer temperatures during Run #3 using finely shredded material. The outlet temperature was set at 220°F.
Figure 5 shows the dryer temperature response during the drying of the un-shredded (control) product. Since the run was short in length, the inlet temperature of the dryer never stabilized before we ran out of product to dry. The average moisture content during this run was approximately 23%. This was much higher than the target moisture content, but we expected it that the un-shredded material would retain more moisture due the larger particle sizes entering the dryer. The finer material was closer to the target moisture content at 13.8% after being dried, but the temperature of the dryer would need to be increased or the feed rate would need to be decreased to achieve 9-10% after drying.
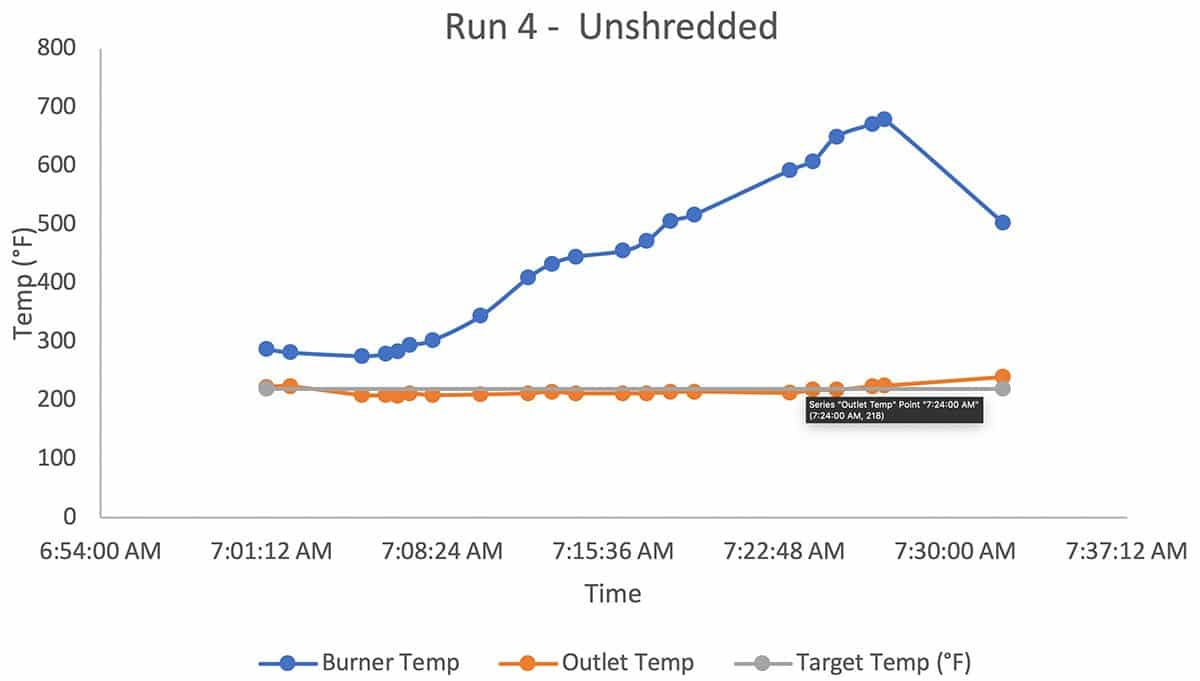
Figure 5: Measured inlet and outlet dryer temperatures during Run #4 using un-shredded material. The outlet temperature was set at 220°F.
After the material was dried, the coarse shredded material was sent to Test 2 for bulk extraction. The finely shredded was used during micro-extractions, but the dry finely shredded material wasn’t sent to Test 2 because the dryer controls malfunctioned, and we didn’t want to leave the wet shredded material sitting too long before being dried at Test 2. The micro extraction data is graphed in figure #. This compares the CBD yield percentages of the wet product before and after shredding it between the Test 1 and Test 2 facilities. It appears that shredding it prior to drying significantly increased the yields for both the coarse and fine shreds in Test 2. In fact, the coarse shred yielded more than double the CBD percentage than the control and the fine shred yielded 150% more than the control sample. In Test 1 however, the decreased the yield percentages from the control insignificantly for the coarse shred and by approximately 18% for the fine shred.
Since the Test 2 samples actually increased their yields with shredding, it indicated that the dryer at Test 1 is most likely causing some product degradation when passing through the dryer. A couple solutions to this would be decreasing the temperature of the dryer, but the feed rate would need to decrease as well in order to achieve our target moisture content. If we kept the same feed rate with lower temperatures, we could also prevent CBD degradation, but the product contain too much moisture for long term shelf life. Another solution to this problem would be to utilize the dryer at a fast feed rate and significantly lower the moisture of the hemp at lower temperatures to approximately 30-20% moisture. Then, with another secondary dryer the product could be slowly and gently dried to the 10% final moisture content for long term storage.
Click graphs to zoom.
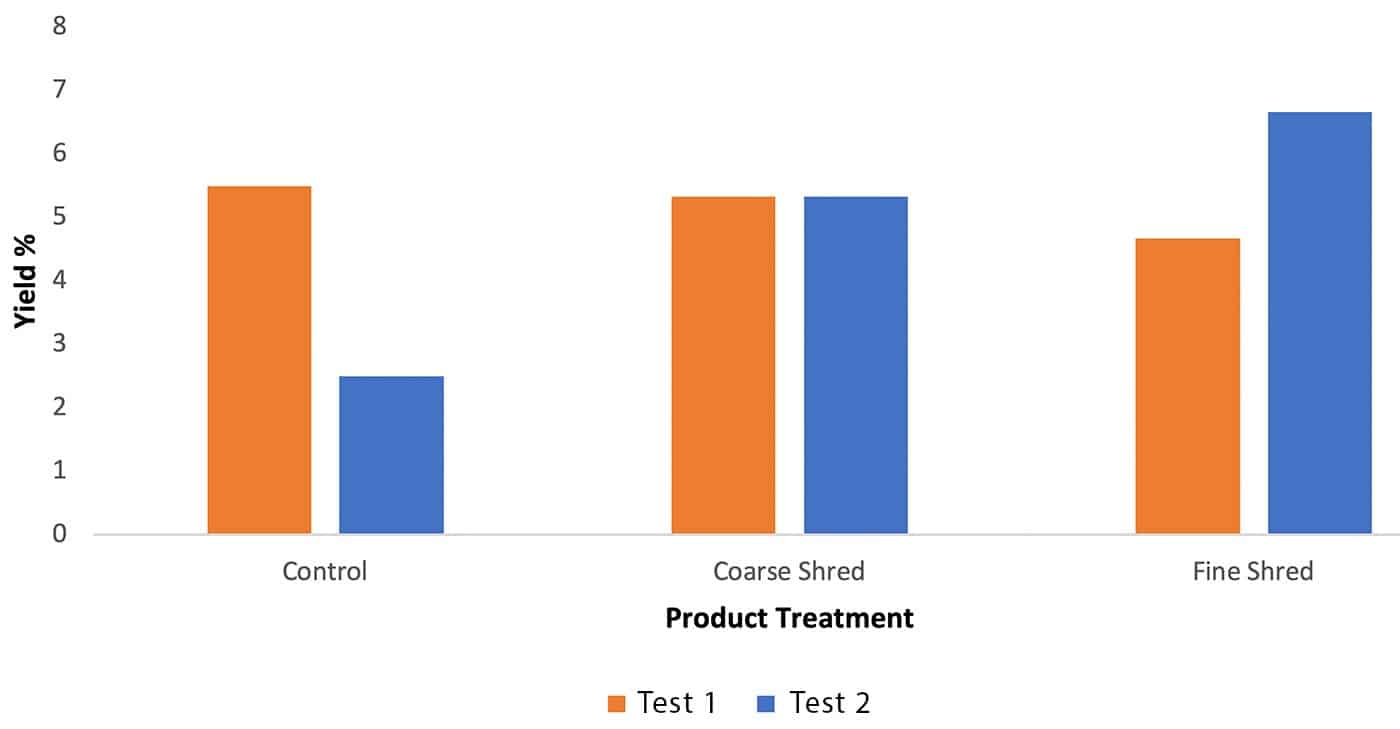
Figure 6: Compares the micro-extraction yields with the product treatments prior to drying at the Test 1 and Test 2 Facilities.
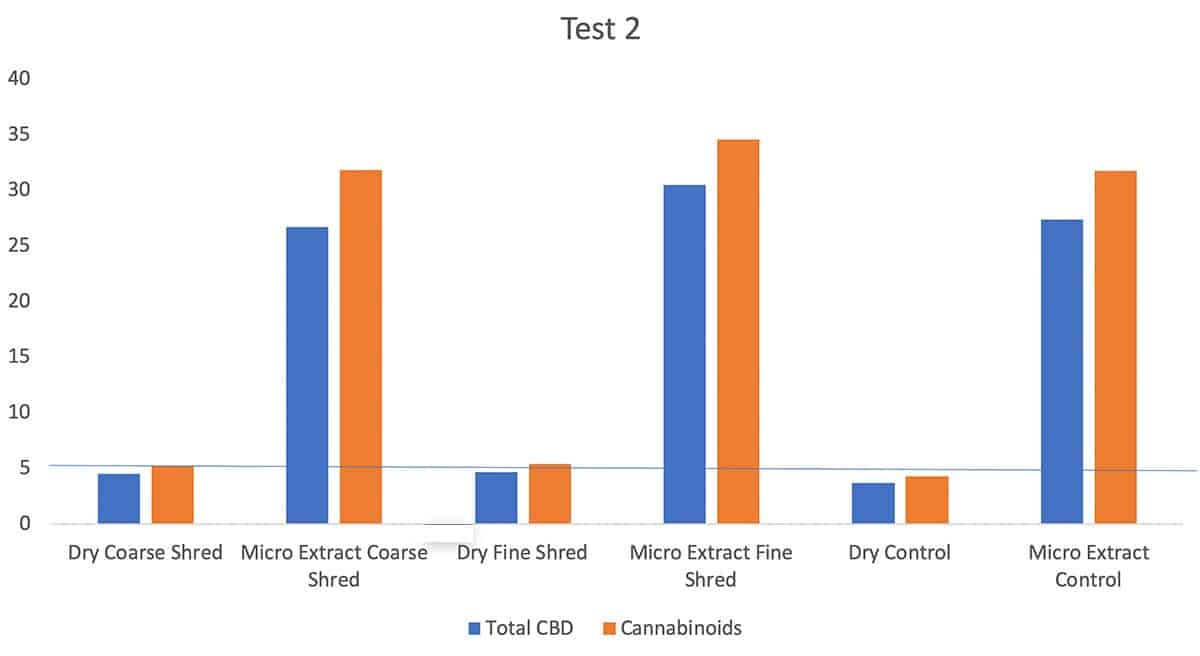
Figure 8: Total CBD and Cannabinoids for various samples at Test 1 facility.
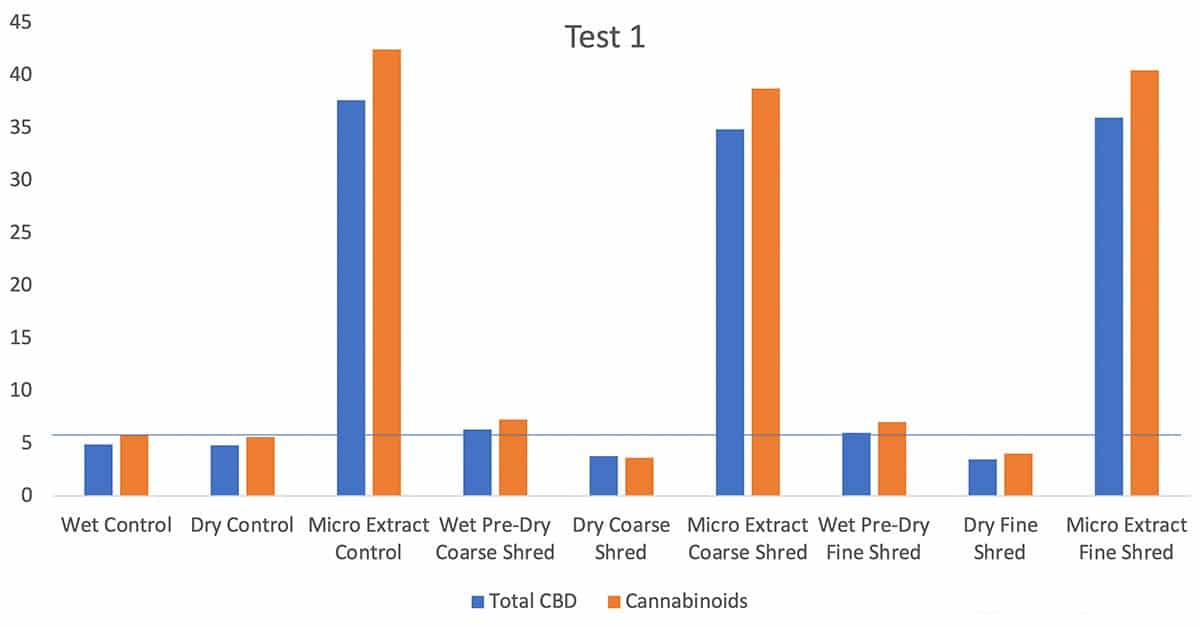
Figure 7: Total CBD and Cannabinoids for various samples at Test 1 facility.
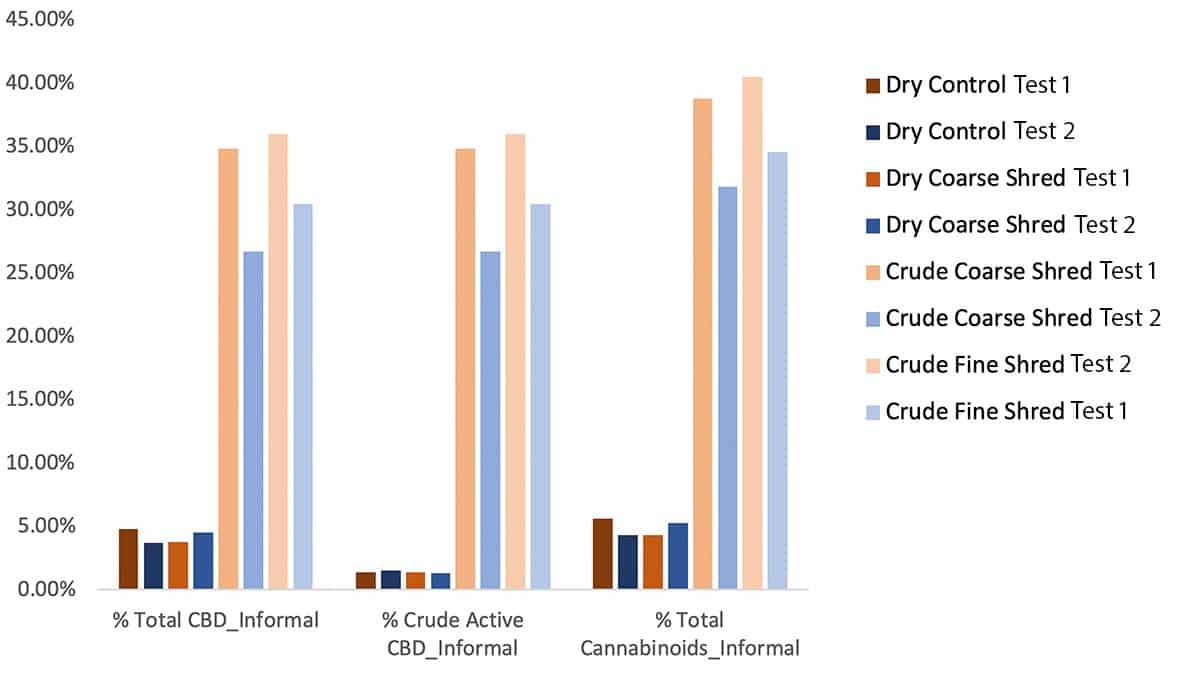
Figure 9: Compares similar available data from COA’s performed on the material dried at the Test 1 and Test 2 facilities on 8/22.
Contact Us
Reach out for a quote, more information, or just to talk about your process. We love discussing new ideas and want to hear about your application.

Visit Us
13911 NW 3rd Ct.
Vancouver, WA 98685
Contact us
(503) 248-0711
frontdesk@abmequipment.com
Open Hours
M-F: 8am – 5pm